

UK net migration has dropped to the lowest level, outside of the Covid pandemic, since 2012.
How does that sit alongside other key migration measures, including asylum applications, small boat arrivals and visas granted?
Scroll down to find out more about the latest key figures, and get answers to key questions on a range of topics.
Small boat crossings and other illegal arrivals
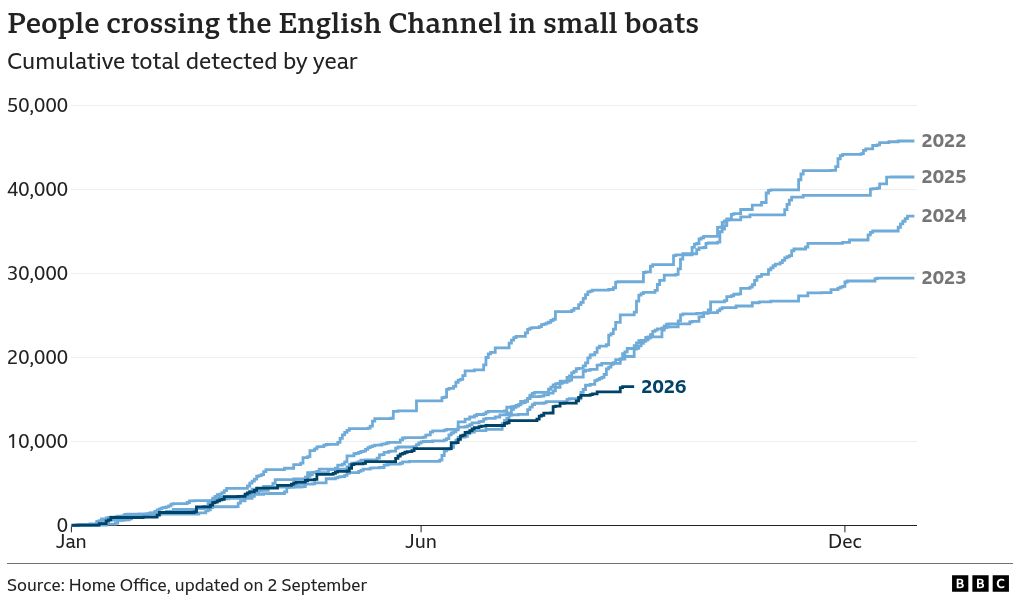
How many people cross the English Channel in small boats?
Between 1 January and 27 September 2026, a total of 19,135 people crossed the English Channel by small boat from France. This was down by 42% on the same period the previous year.
These crossings have become the most common way for people to be detected entering the UK illegally since 2020.
Nearly all those who arrive by small boat claim asylum. Under international law, this means they are allowed to stay in the country while their asylum application is considered.
Small boat arrivals made up 40% of asylum applications between July 2025 to June 2026.
Boats that arrived in the UK from 28 September 2025 to 27 September 2026 carried an average of 67 people. This has more than doubled since 2021.
Experts say overcrowding in boats makes crossings riskier. At least 84 people died while attempting to cross the Channel in 2024, according to the United Nations (UN).
When looking at the scale of small boats crossings, the number of these arrivals is about 5% of the size of total immigration into the UK from January 2025 to December 2025.
The government has pledged to “smash the gangs” behind these crossings in order to reduce the numbers.
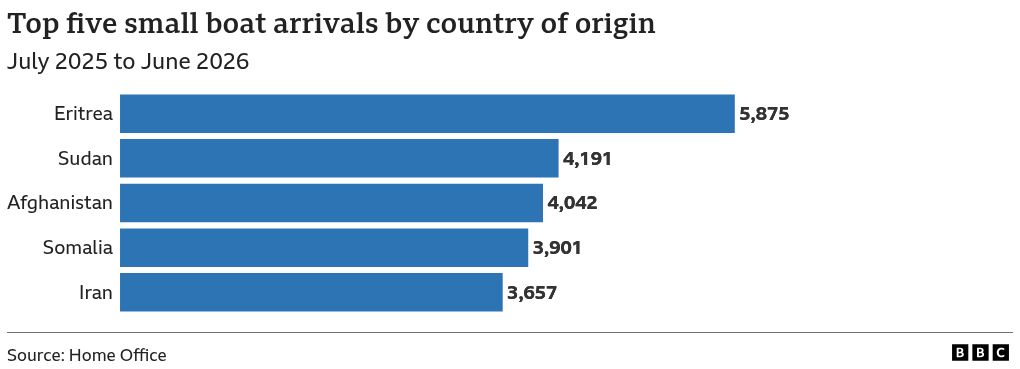
Who is arriving in the UK on small boats?
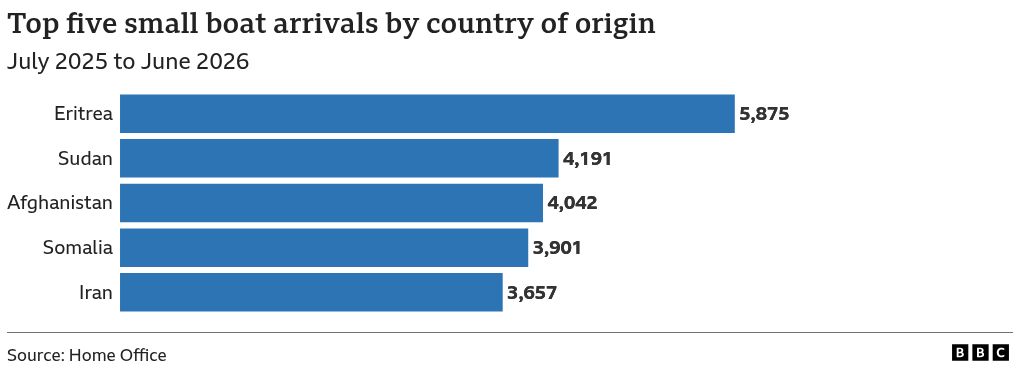
People from Eritrea accounted for 18% of all arrivals from July 2025 to June 2026.
In the latest figures covering January 2025 to December 2025, at least 2,335 people who arrived by small boat were found to be potential victims of human trafficking or other forms of modern slavery, according to the Home Office.
How else do people stay in the UK without permission?
Another 4,712 people were detected entering the UK without permission via other methods including hiding in vehicles, travelling on ferries or through airports from July 2025 to June 2026. This was down by 17% on the same period the previous year.
There are also individuals who arrive legally, for example via a work or study visa, and then overstay their limit.
The total number of people who live in the UK illegally after arriving legally is not known.
Asylum applications and hotels
How many people are in asylum accommodation?
An asylum seeker is someone who wants to be in the UK because they say they cannot live safely in their own country due to persecution or violence.
The government must house an asylum seeker if they cannot financially support themselves while their claim is being considered. There were 89,089 people in asylum accommodation as of June 2026.
About 18% of those people, 16,021, were in hotels. These are used when there is not enough shared housing available, such as houses of multiple occupation (HMOs) or former military sites.
The government has pledged to stop the use of hotels by 2029.
More people are in hotels across the south of England than elsewhere in the UK, while HMOs are more common in the north of England and Scotland.
Numbers of asylum seekers in hotels by council area
A modern browser with JavaScript and a stable internet connection is required to view this interactive
Type in a postcode or the name of a local council below to see how many asylum seekers are housed in the area
How many people apply for asylum in the UK?
A total of 85,891 people applied for asylum in the UK from July 2025 to June 2026. This was down by 21% on the same period in the previous year.
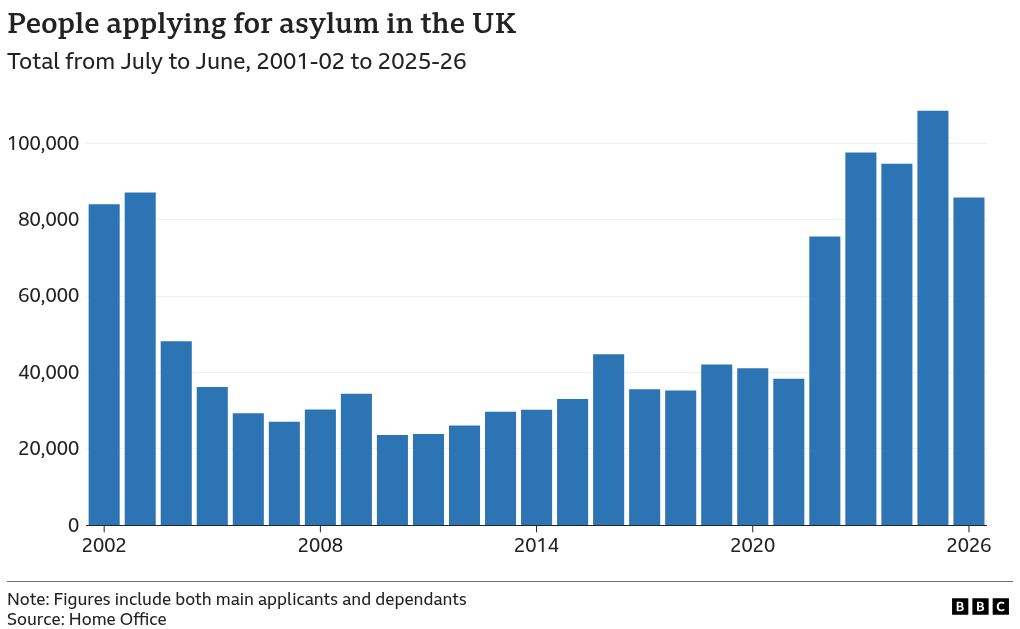
Most people who arrive in the UK by small boat claim asylum, but they were only 40% of all asylum seekers from July 2025 to June 2026.
The rest include people who arrived by other illegal means or who came to the UK legally and applied for asylum while holding, or just after holding, a valid visa.
How big is the asylum backlog?
It can take years for the government to decide whether someone should be granted asylum.
In June 2026, 40,168 people – across 32,401 asylum applications – were waiting for an initial decision. The number of people awaiting an initial decision was down by 56% on the previous year.
As of June 2026, a further 90,341 refused asylum applications were part of a second backlog, waiting the outcome of an appeal in the courts. This was up by 51% on the previous year.
Together, these initial decision and appeal cases form the government’s total asylum applications backlog, which it has pledged to clear.
Refugee status was granted in about 38% of asylum decisions made by the Home Office from July 2025 to June 2026.
About 39% of asylum appeal cases concluded between January 2026 to December 2026 resulted in a previous refusal decision being overturned.
Returns and deportations from the UK
How many people are returned or deported from the UK?
The government requires people who are in the UK, but no longer have permission to live or work in the country, to leave.
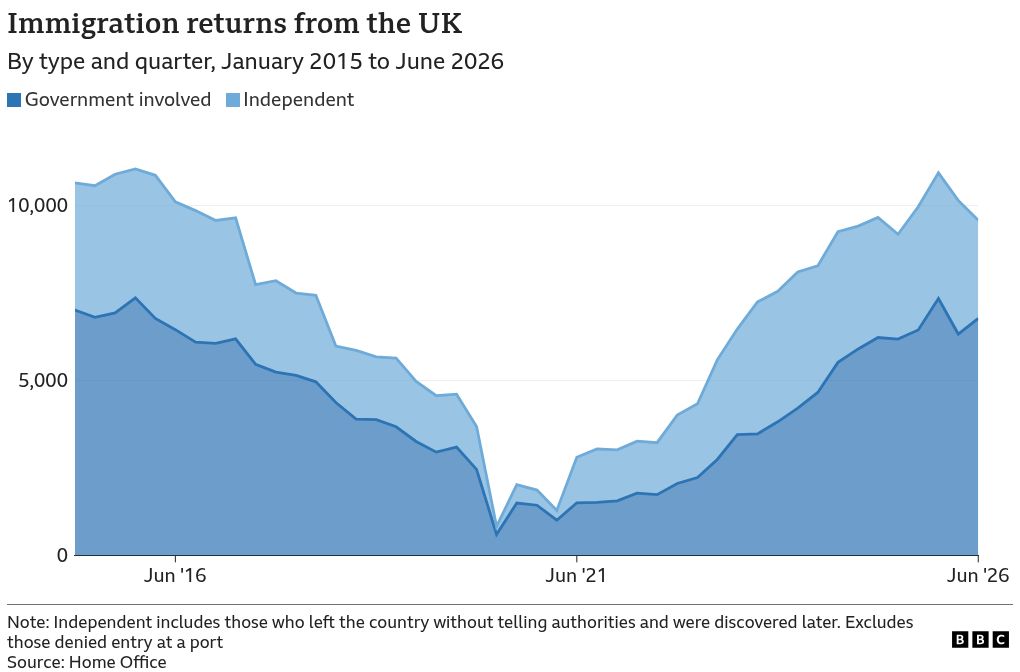
This is called a return and can happen voluntarily or involuntarily.
People can lose the right to be in the UK for different reasons, such as a visa expiring, an asylum claim being refused, or by receiving a criminal conviction that results in deportation.
There were 40,605 returns from July 2025 to June 2026. This was up by 8% on the same period the previous year.
That number of returns is equivalent to about 6% of total emigration from the UK from January 2025 to December 2025.
Who is returned from the UK?
Of all returns from July 2025 to June 2026:
- 5,962 had been convicted of a criminal offence
- 12,568 had lodged an asylum claim at some point
- 3,310 had arrived in the UK by small boat
People from India made up 27% of all returns from July 2025 to June 2026.
What is the ‘one in, one out’ deal with France?
The UK is trialing a scheme with France to return people who arrived in the country on a small boat.
For every person the UK sends back to France, the UK will accept an equal number of asylum seekers.
This is called the “one in, one out” deal. As of 30 June 2026, 1,087 people have been returned through this arrangement.
How do people leave the UK under immigration control?
Returns can happen in different ways. “Enforced returns”, which includes deportations, means the government arranges transport to return people to a different country. In some cases, people are escorted by officers.
All other returns are “voluntary”. This means a person has agreed to leave and may receive government help with travel and other costs to help facilitate the return.
Some people classed as leaving the country voluntarily do so completely independently and without any government knowledge or involvement.
Independent returns made up 34% of the total from July 2025 to June 2026.
Visas for legal migration
How do people come to the UK legally?
Most people who come to the UK do so legally, after being granted a visa before they travel.
A visa gives someone permission to enter or stay in the UK for a specific purpose, such as work, study or joining family members.
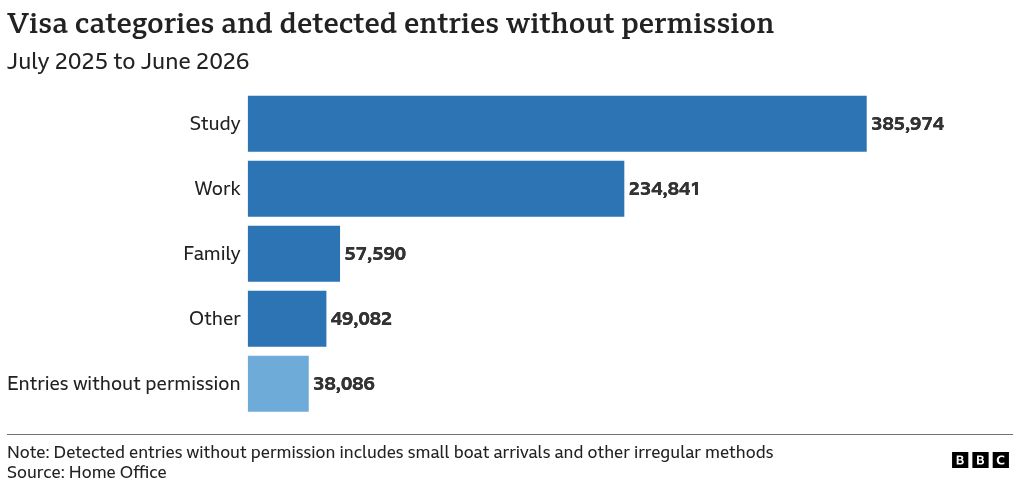
There were 727,487 people who came to the UK via visas from July 2025 to June 2026, not including visitors or people transiting through the UK. This was down by 15% on the same period the previous year.
That does not mean all those people travelled to the UK, only that they were approved to do so.
What are the most common reasons for entry each year?
The most common type of visa people came to the UK on was study, which made up 53% of all visa entries from July 2025 to June 2026.
Who gets the most common UK visas?
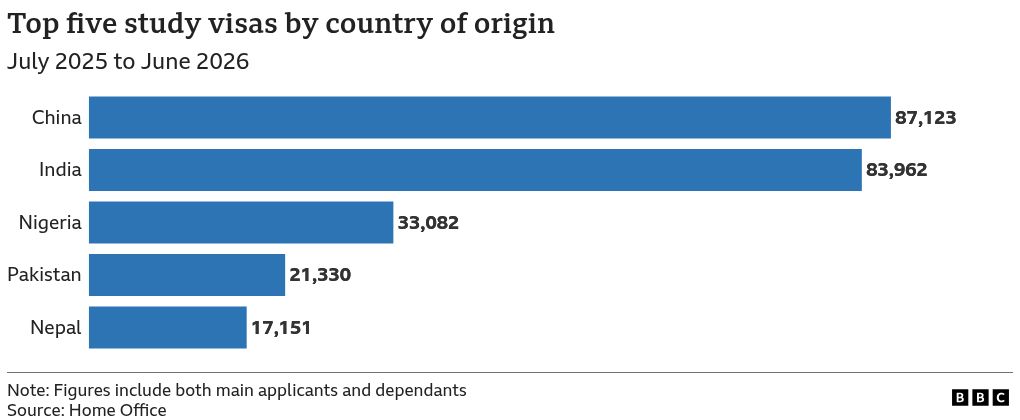
People from China were the most common group to come to the UK on study visas, making up 23% of the total.
Together, people from China and India accounted for nearly half of all study visas. This has been the case for many years.
Migration to Europe
How many people cross to Europe illegally in boats?
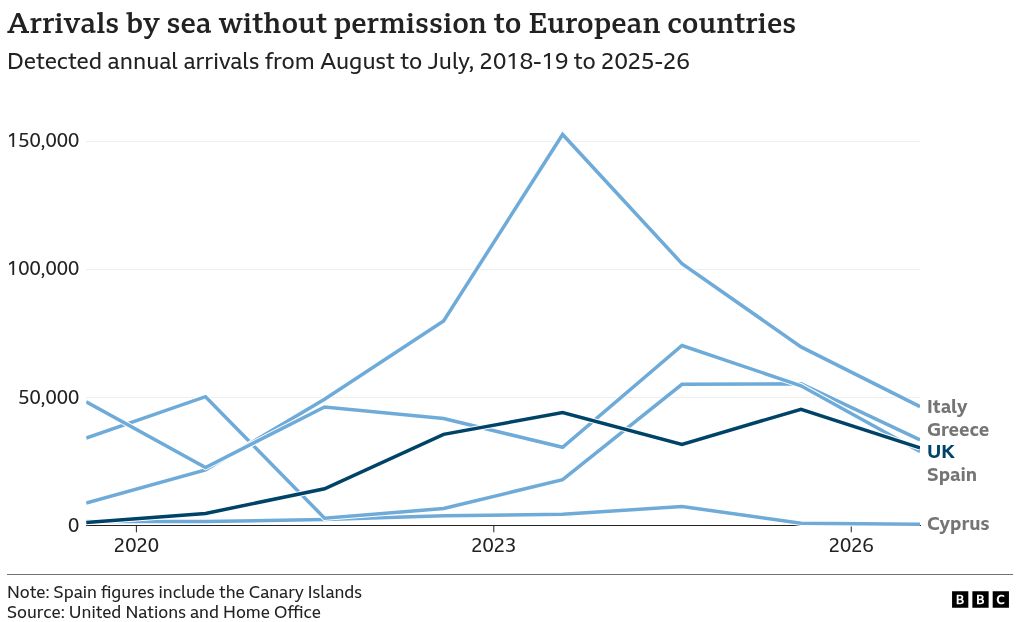
The EU and UK monitor the number of people crossing borders in the Mediterranean and English Channel by sea without permission.
There were 139,288 sea arrivals to the UK, Greece, Italy, Spain and Cyprus from August 2025 to July 2026.
Crossings to the UK accounted for about 22% of the combined total.
Sea arrivals into mainland Europe peaked in 2015, when the UN said more than a million people crossed the Mediterranean.
How many people apply for asylum in Europe?
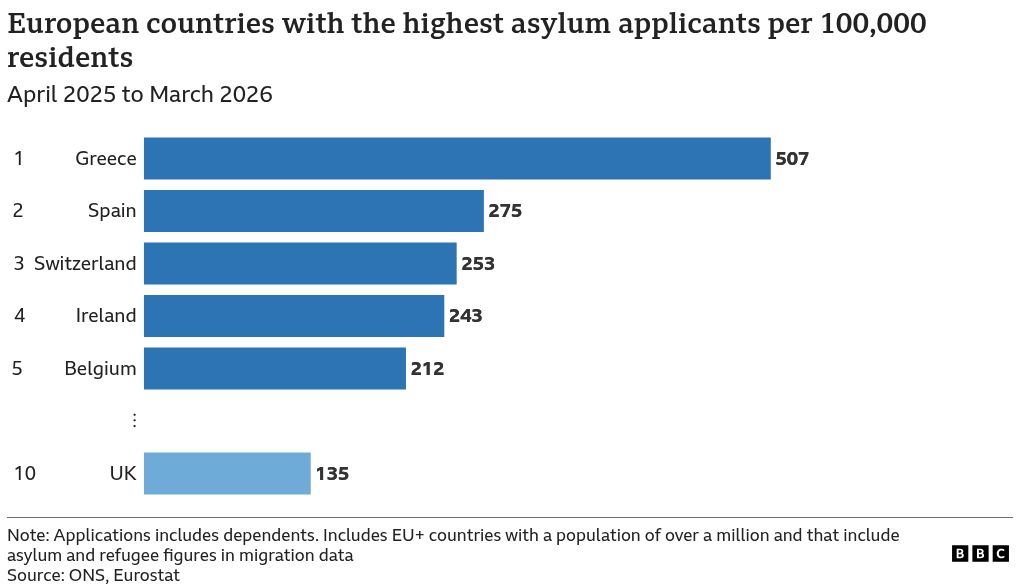
The top three countries with the most people claiming asylum from April 2025 to March 2026 were Spain with 133,795, Italy with 124,740 and France with 111,320.
The UK ranked at number five for asylum claims over the same period when compared with 26 other European countries with populations over one million.
When adjusted for population size, the UK ranks at number 10 for asylum applications per 100,000 people.
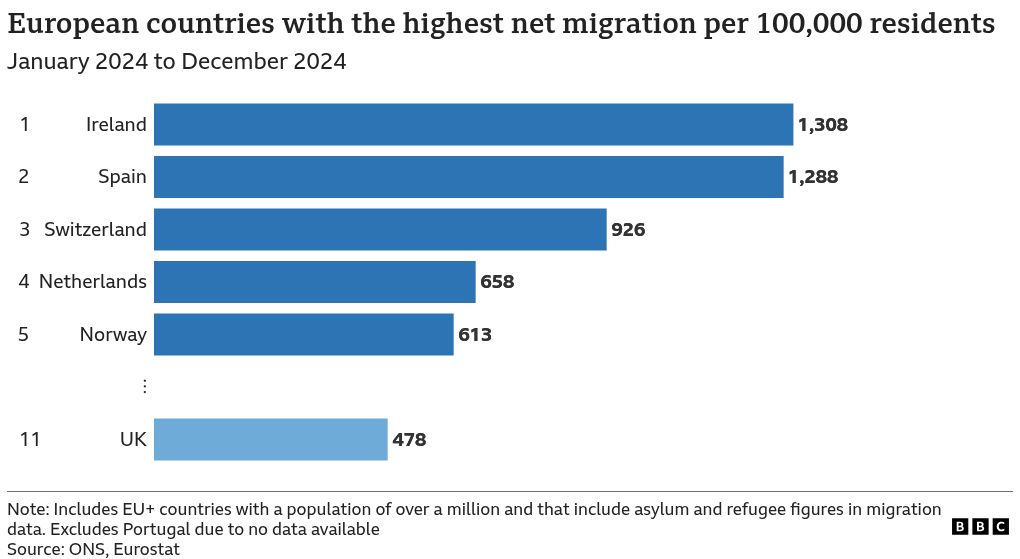
How does net migration compare across Europe?
Net migration measures the overall change in a country’s population due to migration over a given period. It is everyone coming into the country (immigration) minus everyone who leaves (emigration).
The latest available data to compare the UK with other European nations is January 2024 to December 2024.
At that point, the countries with the biggest increase in their population were Spain with 626,000, Germany with 494,000 and the UK with 331,000, after taking into account the people who left the country, and those who arrived.
When adjusting for population size, the UK was in position 11 for increase in population due to migration, alongside 13 other European countries with comparable data per 100,000 residents.
-
Is the government meeting its pledges on illegal immigration and asylum?
-
Published26 February
-
-
Why do Channel migrants want to come to the UK?
-
Published9 July 2025
-
-
Find out more about people crossing the Channel in small boats
-
Published22 October 2025
-
Produced by: Rob England, Libby Rogers, Jess Carr, Aidan McNamee, John Walton, Becky Dale, Allison Shultes, Chris Kay, Steven Connor and Scott Jarvis.
Graphics by: Jez Frazer, Zoe Bartholomew and Joy Roxas
About the data
Figures from government and other official sources can be revised between publications. This page shows data as presented in the latest available release.
Immigration, emigration and net migration
*The net migration figure for the UK will not exactly equal immigration minus emigration because the Office for National Statistics (ONS) publishes it as a rounded number.
Immigration and emigration estimates, external from the ONS are updated twice a year.
Net migration figures use the internationally recognised definition of a long-term migrant: “A person who moves to a country other than that of their usual residence for at least a year.”
Visas for legal migration
The total number of visa entries only includes visas that have been granted. It does not include visitor visas or transit visas, where the UK is not the final destination.
Visa figures record when permission was granted, not when or whether someone arrived in the UK.
If a person was granted more than one visa within the year shown, each visa is counted separately.
Work visas refer to new individuals granted permission, or extensions of existing permission. This includes categories such as seasonal work, health and care, domestic worker and youth mobility visas.
Study visas include all individuals sponsored by approved UK education providers, as well as those on short-term study visas.
Family visas allow someone to come to or remain in the UK to live with close family members already here. This includes joining a spouse, partner, child or parent, or coming to care for a relative.
The “Other” category includes visas outside work, study and family routes. This covers humanitarian schemes such as the Ukraine Sponsorship Scheme and the British National (Overseas) route. It also includes family permits for people from European Union or European Economic Area countries.
Asylum applications and accommodation
Home Office figures for asylum seekers in hotels are published under the category “contingency accommodation – hotel”.
The number of people in all other forms of accommodation includes non-hotel contingency accommodation, as well as initial, dispersal and “other” accommodation.
To show how evenly accommodation is distributed, a scale compares each local authority’s share of people in that type of accommodation with the UK-wide average for areas using the same accommodation type:
-
Less than half – more than 50% below the average share
-
Lower than – between 25% and 50% below the average share
-
About the same as – within 25% of the average share
-
Higher than – between 25% and 100% above the average share
-
More than double – more than 100% above the average share
Backlog figures for people waiting for an initial asylum decision include both main applicants and dependants.
Open appeals against refused asylum applications refer to individuals. Figures on appeals are published every three months by the Ministry of Justice, at a different time from other government asylum statistics. It also includes a small number of appeals against revocation of protection.
Small boat crossings and other irregular arrivals
Small boat crossing figures and the average number of people per boat are taken from the Home Office daily data, external.
Entering the UK without permission is an offence under immigration law, external, but asylum seekers are generally not prosecuted if they claim asylum on arrival. In some cases, people have been prosecuted alongside other offences, such as people smuggling or re-entering after deportation.
The International Organization for Migration (IOM) collects figures on people who have died, external or gone missing while crossing from mainland Europe to the UK. These reports are based on information from French and UK officials (such as police or coastguard) and media sources. The IOM considers them an undercount because there are no official statistics.
The figures may include people who died in the Channel itself, as well as those who died while travelling to a crossing point.
Data on modern slavery includes final decisions only. Modern slavery covers human trafficking, slavery, servitude and forced labour.
Figures for other entries without permission combine all recorded irregular arrivals that were not by small boat. This includes inadequately documented air arrivals, recorded detections at UK ports, and other recorded detections within the UK.
Returns and deportations
People who are denied entry at the border and then leave the UK are not included in the returns figures on this page.
Returns involving the government are grouped into three categories. Enforced returns (which include deportations) are cases where the Home Office requires someone to leave and arranges their removal, usually because they have no legal right to remain or following a criminal conviction.
Assisted voluntary returns are when someone agrees to leave the UK and receives government support, such as help with travel documents, flights or reintegration assistance.
Controlled voluntary returns are when someone leaves the UK voluntarily without being forcibly removed, but their departure is formally recorded by the Home Office.
Independent returns are referred to by the government as “other verified returns,” and refer to individuals who have left the UK without
People returned after a criminal conviction include non-British citizens convicted in the UK of any criminal offence, or convicted abroad of a serious criminal offence.
UK migration compared with other countries
Sea arrival figures are taken from the UNHCR European sea arrivals dashboard and combined with UK Home Office small boat data.
Asylum application, immigration and emigration figures for European countries are the latest available data from Eurostat for: Austria, Belgium, Denmark, Finland, France, Germany, Greece, Ireland, Italy, Netherlands, Portugal, Spain, Sweden, Czechia, Estonia, Hungary, Latvia, Lithuania, Poland, Slovakia, Slovenia, Bulgaria, Romania, Norway, Switzerland and Croatia.
UK population figures are from ONS, National Records of Scotland and the Northern Ireland Statistics and Research Agency 2024 mid-year estimates. European population figures are from Eurostat as of 1 January 2024.
To ensure comparability with the UK, European countries with populations under one million are excluded from per-capita comparisons of net migration and asylum applications.
For net migration comparisons, only countries that include asylum seekers or refugees in their immigration figures are included.
These are: Austria, Belgium, Estonia, France, Germany, Greece, Ireland, Italy, Netherlands, Norway, Slovenia, Spain and Switzerland.
Portugal was also excluded as it did not have net migration data available for 2024, it will be re-included in future updates.


